Enterprise Analytics: Data-to-Action Productivity Ecosystem
The Problem
My client ran an estate agency franchise network across Greater London, but often felt overwhelmed when identifying customer retention gaps, effective resource management for their teams, and easy-to-understand reporting tools. Tracking daily sales activity, phone calls, viewing cadences, and flexible shift schedules required cross-referencing disconnected spreadsheets and five legacy desktop tools. To further understand the core problems at the forefront of the client's business franchise, I sat down with daily users and employees of the organisation as well as key stakeholders to paint a holistic map of where their existing routines fell short, the client's vision for an all-in-one platform, and how we could bridge the gap. Initial assessment revealed three critical friction points: • Cognitive Overload: Users were forced to cross-reference multiple platforms and spreadsheets, resulting in decision paralysis and ignored metrics. Over half of context-free tabular metrics were ignored by managers. • Broken Visual Hierarchy: Inconsistent visual hierarchy in legacy components hid vital secondary metrics, causing branch managers to miss critical daily bottlenecks. • Lack of Rolling Benchmarks: Performance couldn't be compared across timeframes (today vs. yesterday or rolling 30-day averages) without leaving the screen or manual spreadsheet math. A forensic audit of existing client mockups and competitor tools further isolated key structural design opportunities: • What Worked: High-level glanceability (radial progress rings and circular charts communicated operational health faster than plain text tables), intentional modularity (breaking views into distinct thematic cards like appraisals and productivity laid a strong foundation for a widget-based system), and visual categorization (grouping metrics by business domain helped managers separate sales activity from communication streams). • What Was Missing: Zero update cadence (no visual distinction between real-time events like live calls and asynchronous batch metrics like weekly/monthly totals), missing state boundaries (lacked essential states: loading indicators, empty states, network latency buffers, and error recovery), and static shift assumptions (hardcoded for 9-to-5 schedules, failing to account for part-time rotas or flexible working patterns).
Client Original Mockups
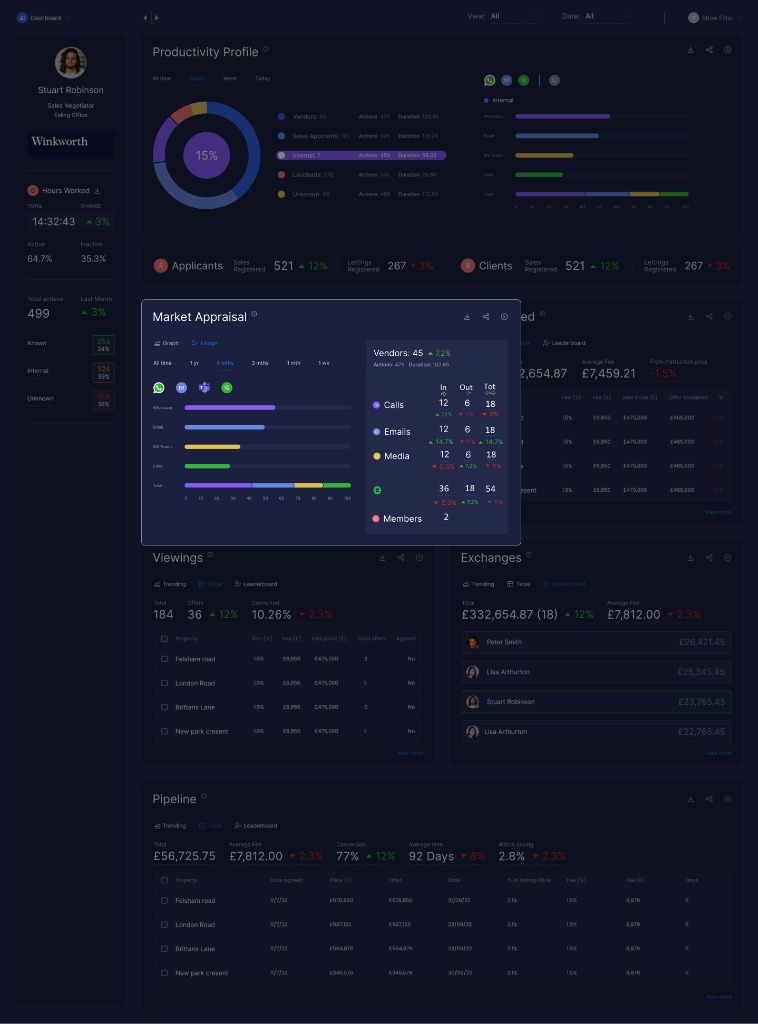
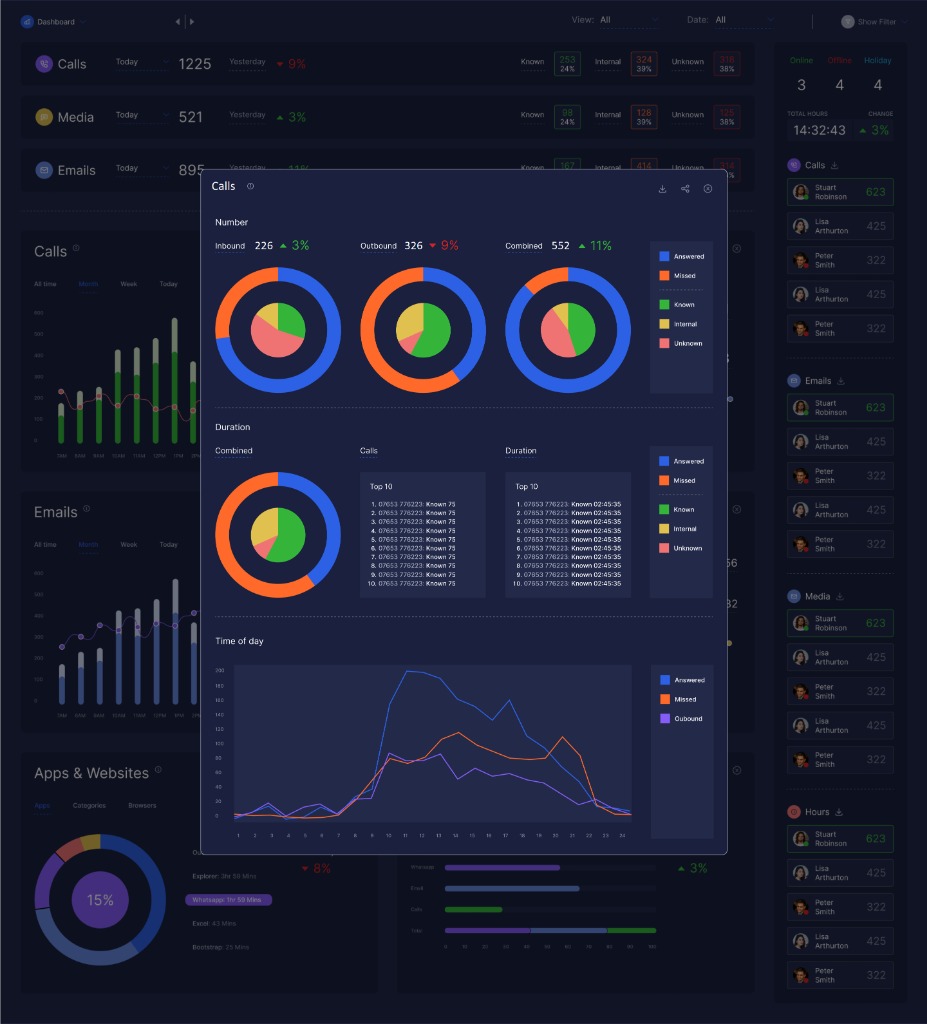
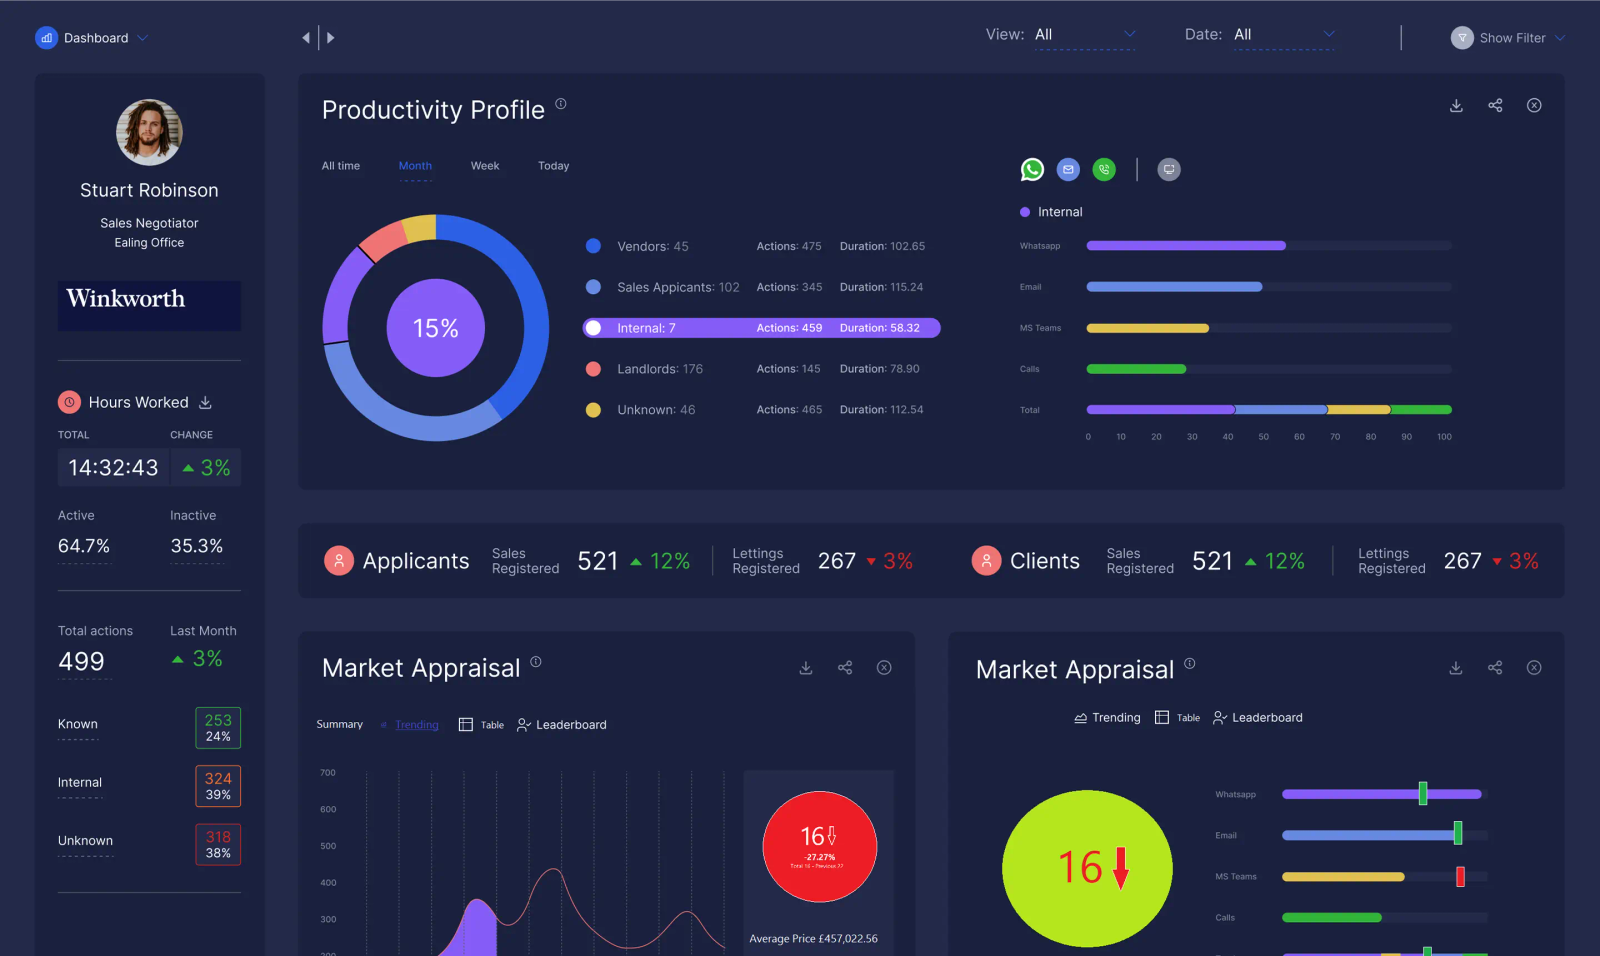
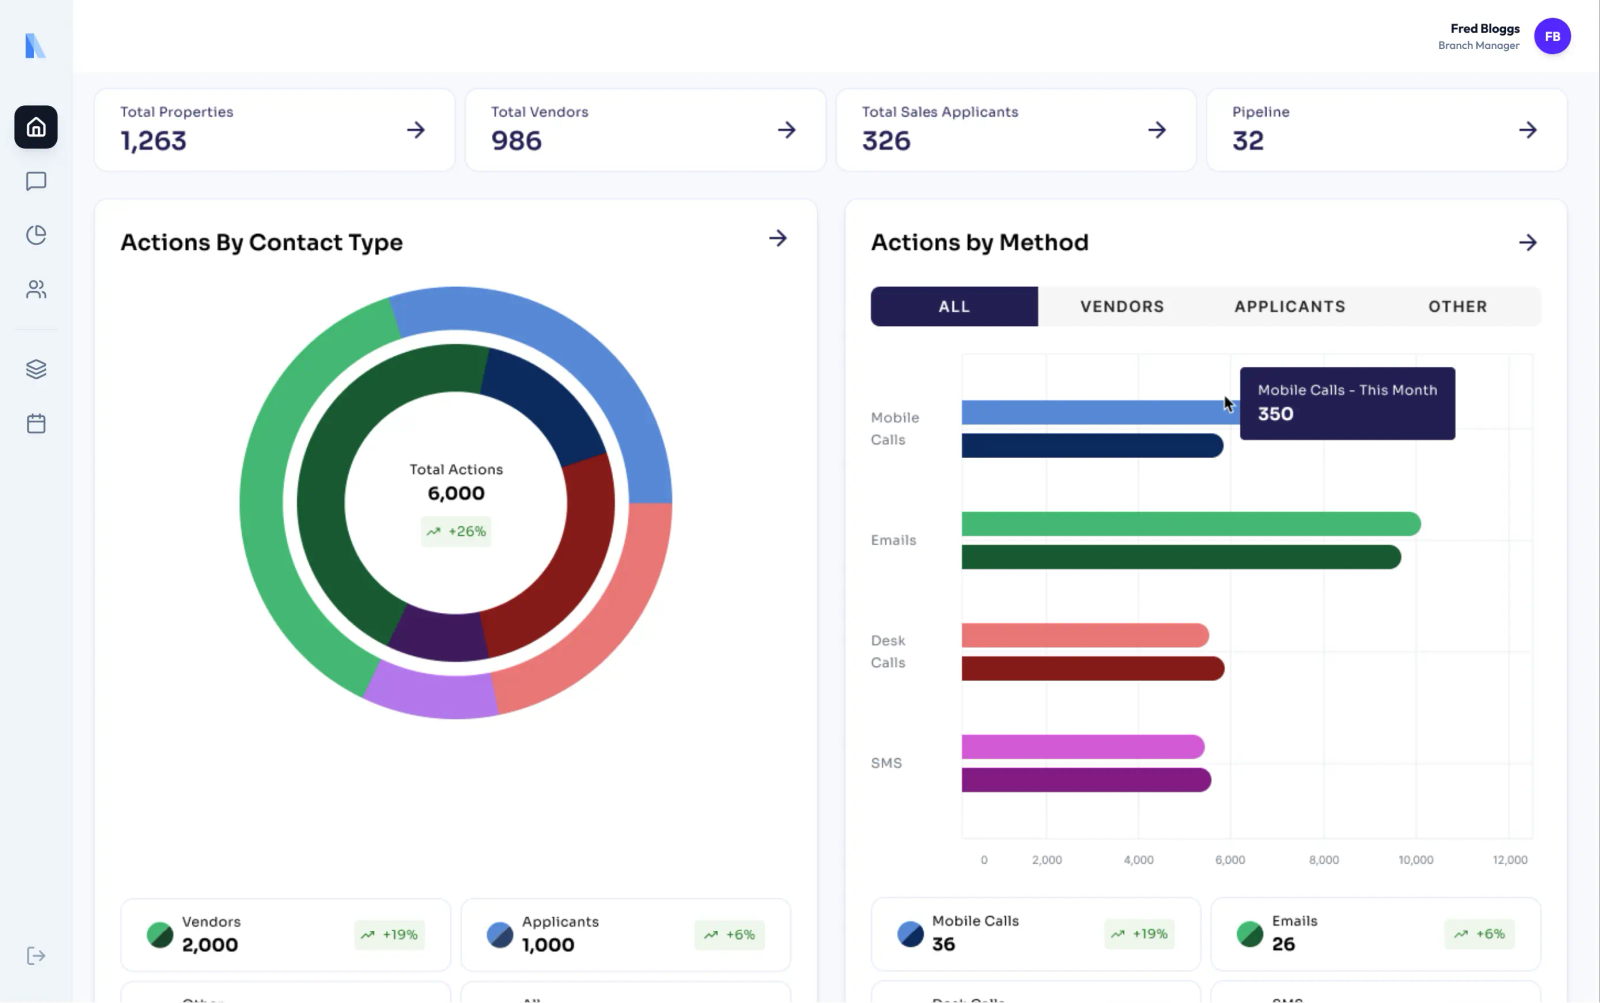
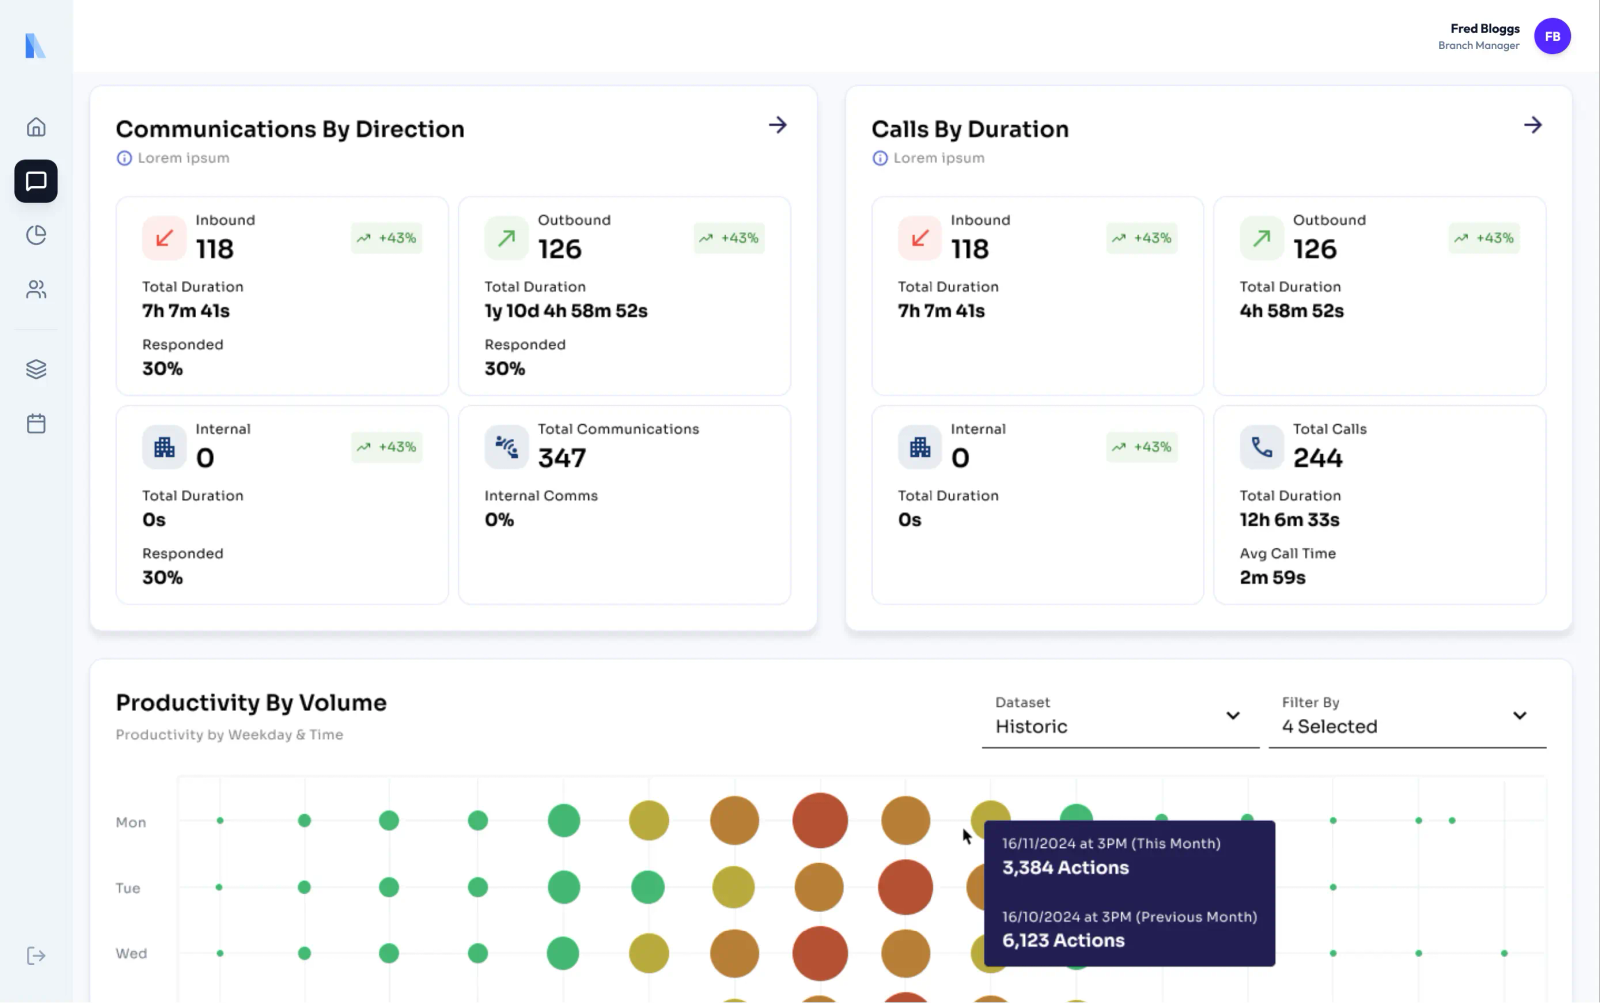
The legacy interface drowned managers in dense data tables and non-cohensive design patterns.. We re-engineered the experience to focus on actionable signals rather than raw numbers. By implementing high-level visualizations—like progress rings and heatmaps—managers can now assess team health in seconds, not minutes.
The Solution
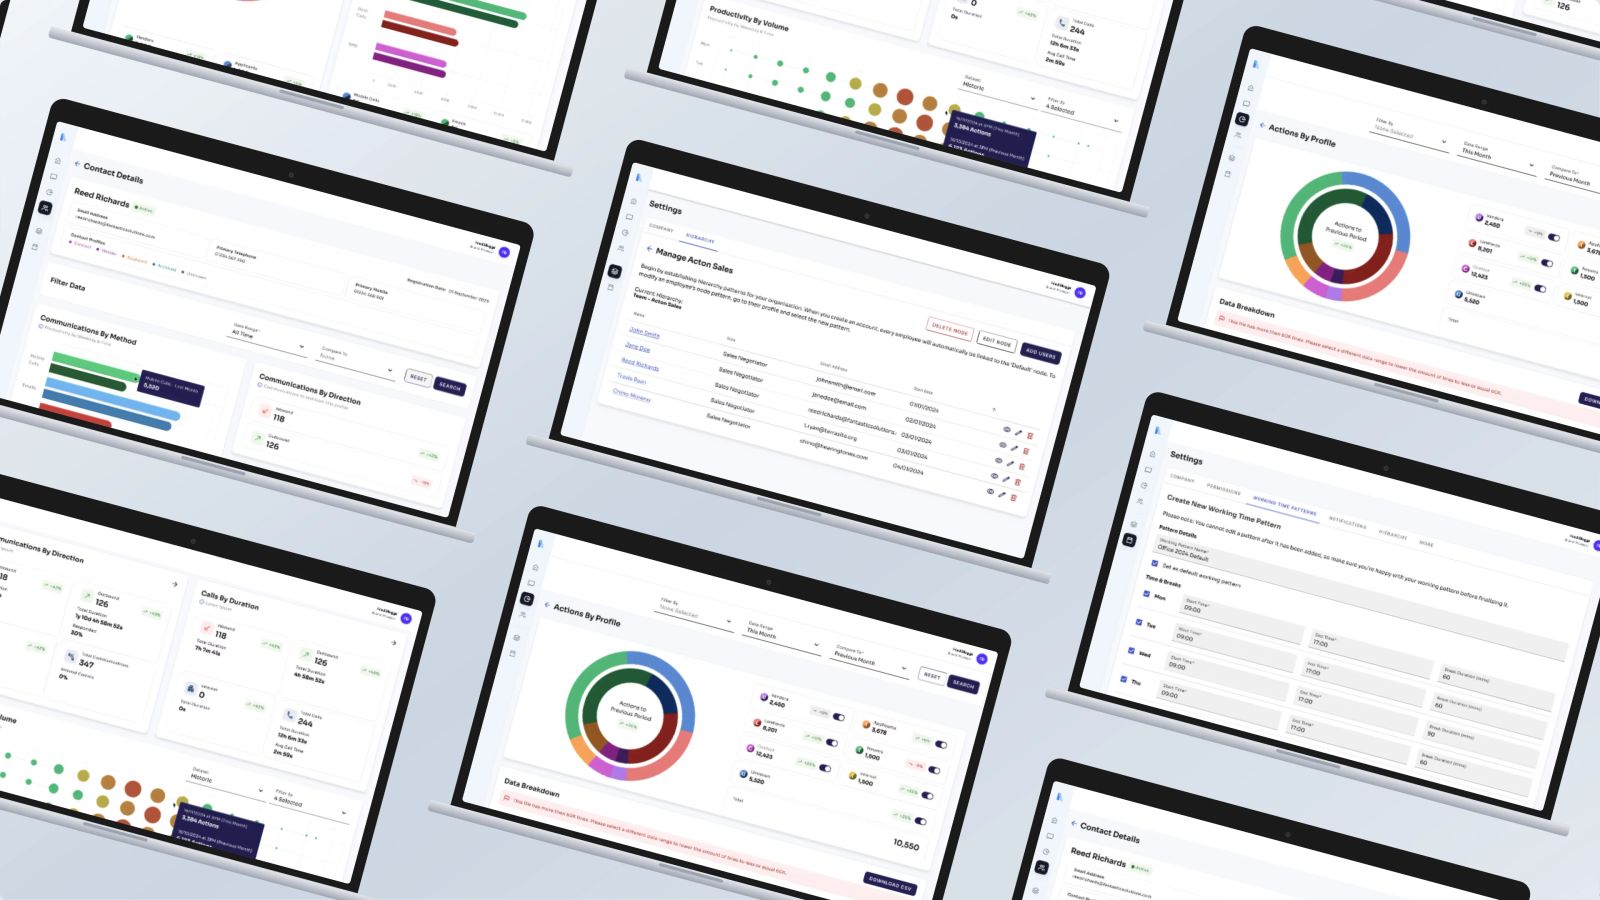
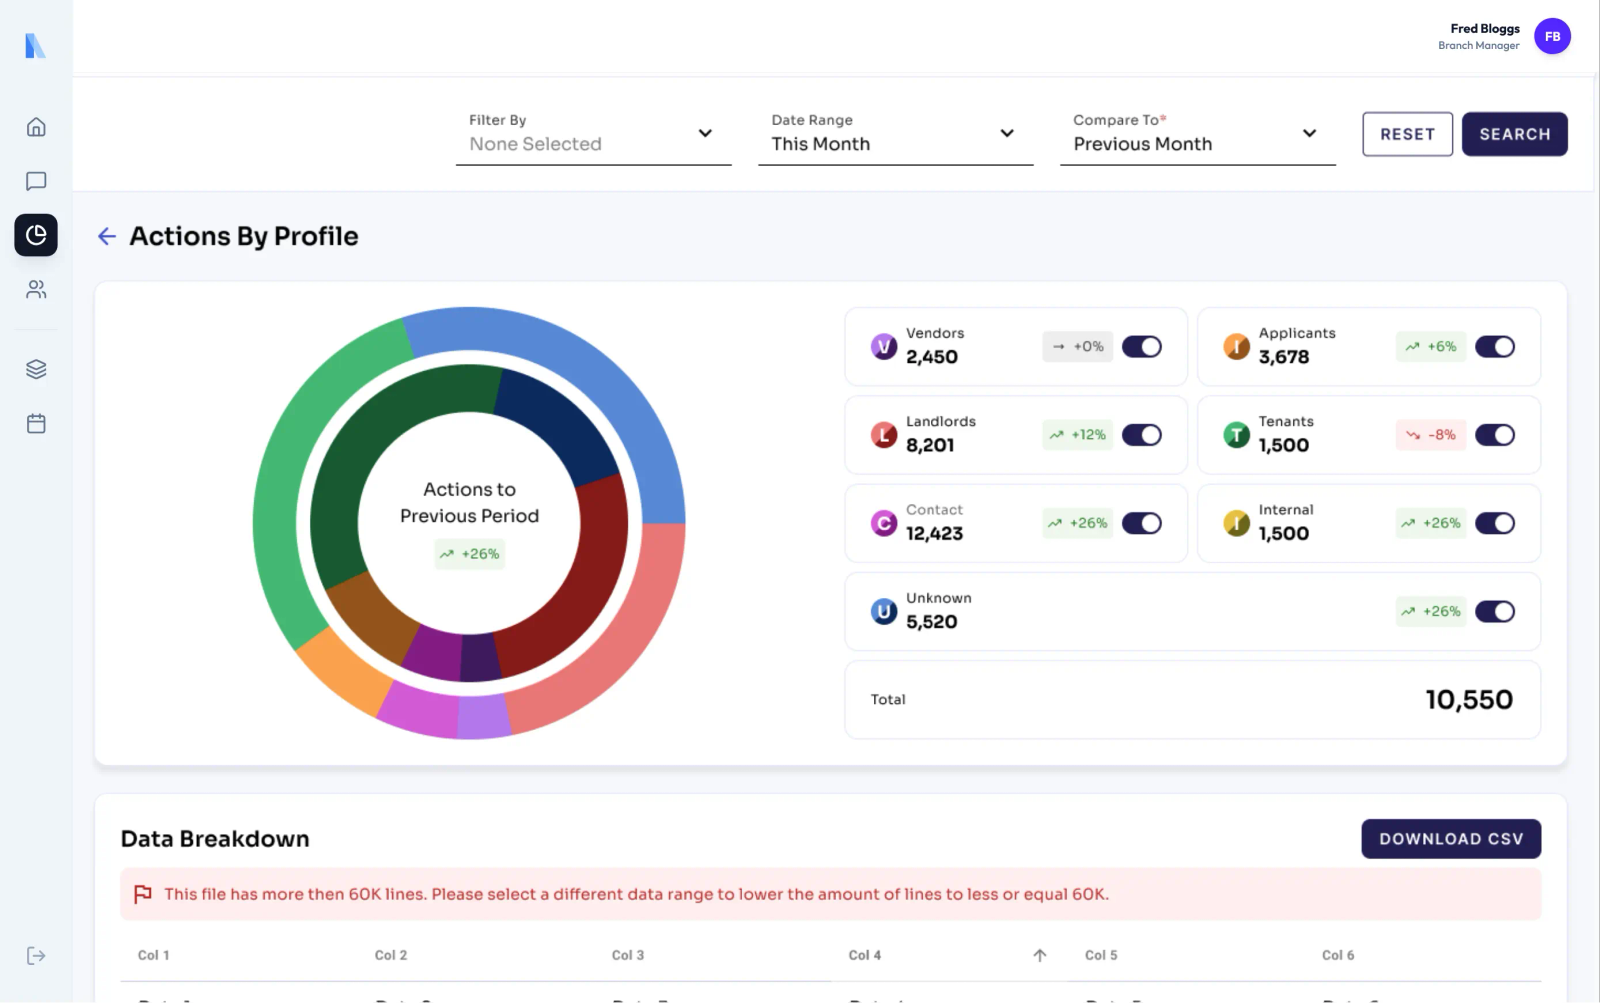
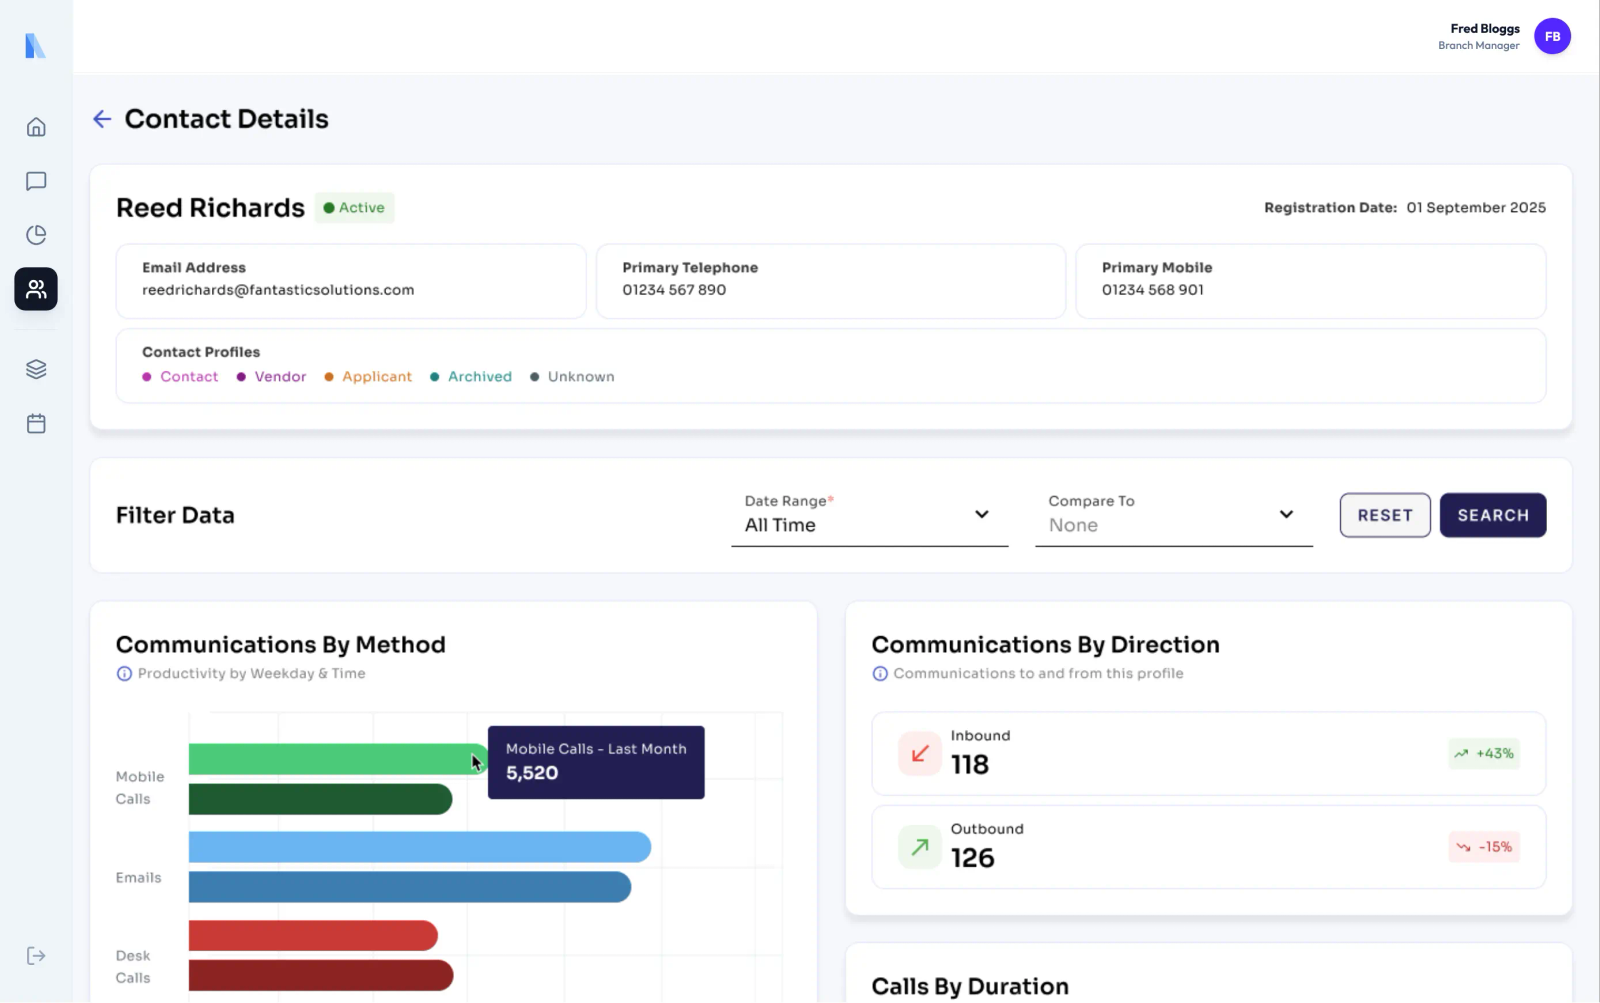
I engineered an enterprise analytics web portal that empowers real estate agency managers across Greater London to identify and remedy gaps in employee and client engagement through modular date comparison tooling, operational health cards, and live reporting. Built on Angular Material, ChartJS, Storybook, and Microsoft Azure/Entra, the platform was deployed live across 5 franchise branches. To bridge design and engineering without mid-sprint rework, I architected an AI-assisted rapid prototyping pipeline: feeding our Angular Material Storybook components, JIRA requirements, and Figma design tokens into Claude and Cursor agents via Model Context Protocol (MCP). With a single source of truth kept in code (binding Angular Material theme variables directly to custom semantic tokens), we established 1:1 prototype fidelity and maintained a validated 1-2 sprint runway for the engineering team. We replaced rigid, text-heavy tables with dynamic performance rings, peak activity heatmaps, and modular metric cards powered by ChartJS and real-time event listeners. The resulting workspace surfaces real-time inbound/outbound communications, appointment cadences, and shift-aware benchmarks in a scannable, actionable stream that managers rely on for their daily morning operational check.
The Process
Refining Requirements & Sprint Sizing
Refining requirements into actionable sprints, based on prior conversations with key stakeholders, end-user interviews, and discussions with the Product Owner. We systematically separated 'nice-to-have' functionality versus 'need-to-have' features to establish clear design and dev priorities. To protect sprint velocity, we weighted story points by leveraging Angular Material baseline components wherever possible versus bespoke designed components that would demand extended engineering cycles.
Challenging Assumptions via 3 Service Maps
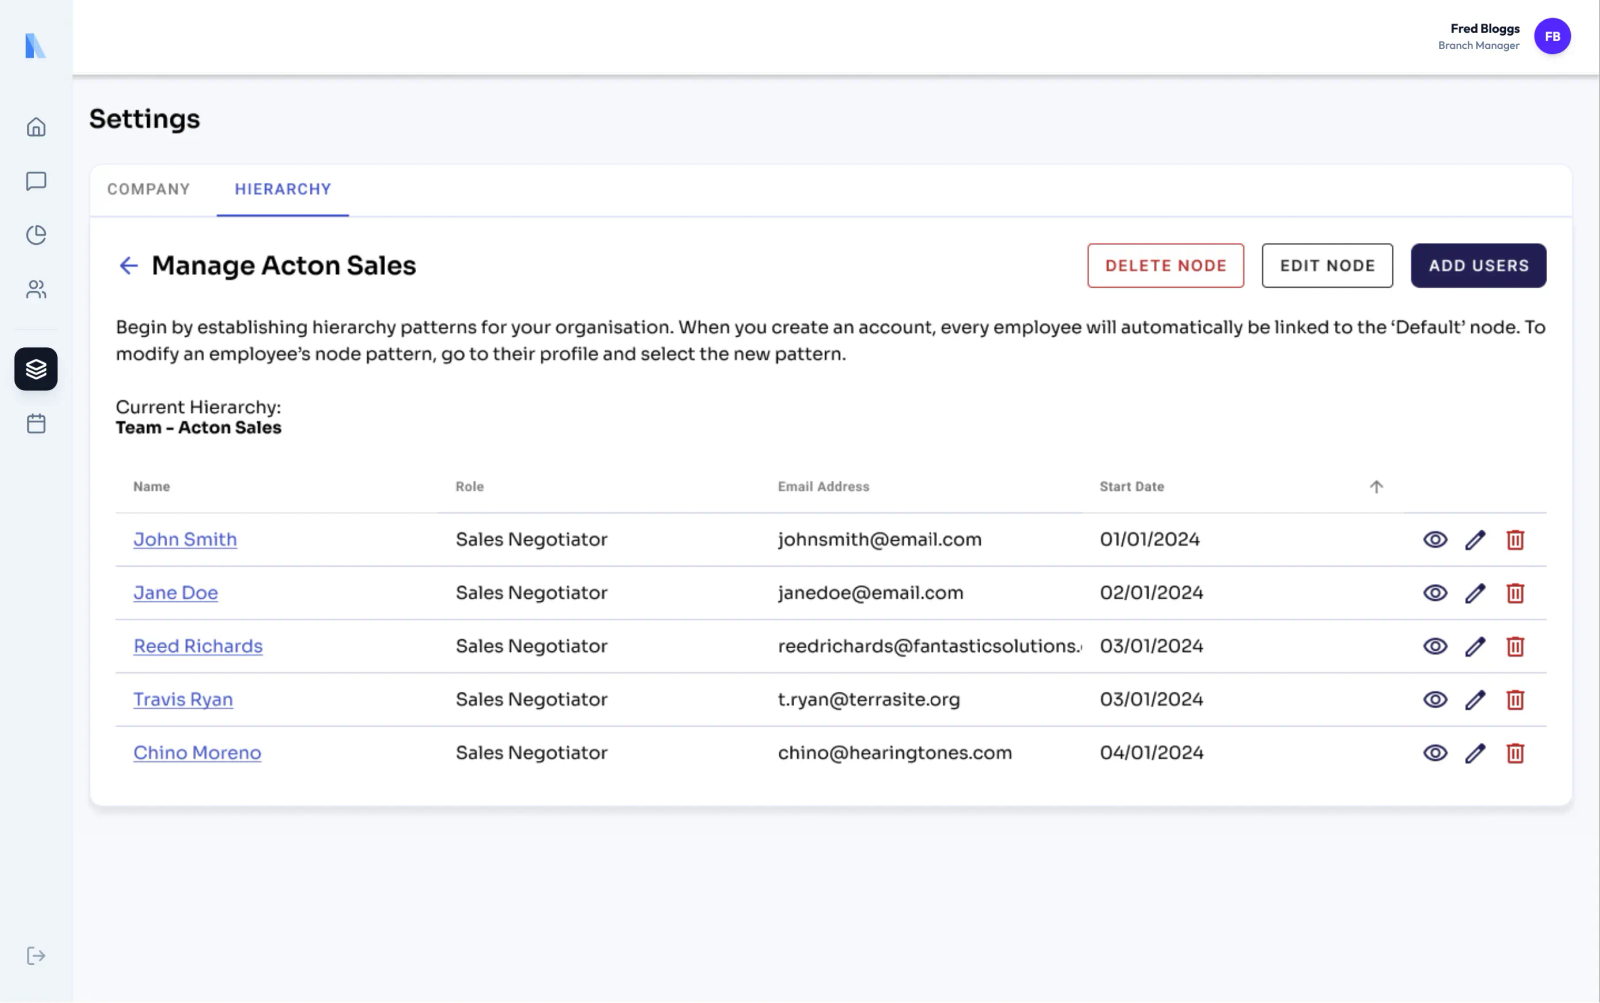
Mapped holistic service blueprints across three operational tiers to challenge legacy workflow assumptions: • Company User: Mapping the daily flow that business owners and branch managers log into to inspect modular sections of their business (Communications Hub, Sales Intelligence, Lettings Management, and Team Productivity). • B2B Platform Admin: Managing B2B customers in a single unified portal with bespoke 4-step CRUD/setup wizard functionality, live Microsoft Entra ID directory handshake status, cross-tenant security audit logs, and secure user impersonation. • Customer Admin: Enabling tenant admin teams to effectively CRUD their organisation data, manage branch hierarchies, review Azure/Entra ID sync queues, and assign working time patterns.
Hierarchy-Based Working Time Patterns
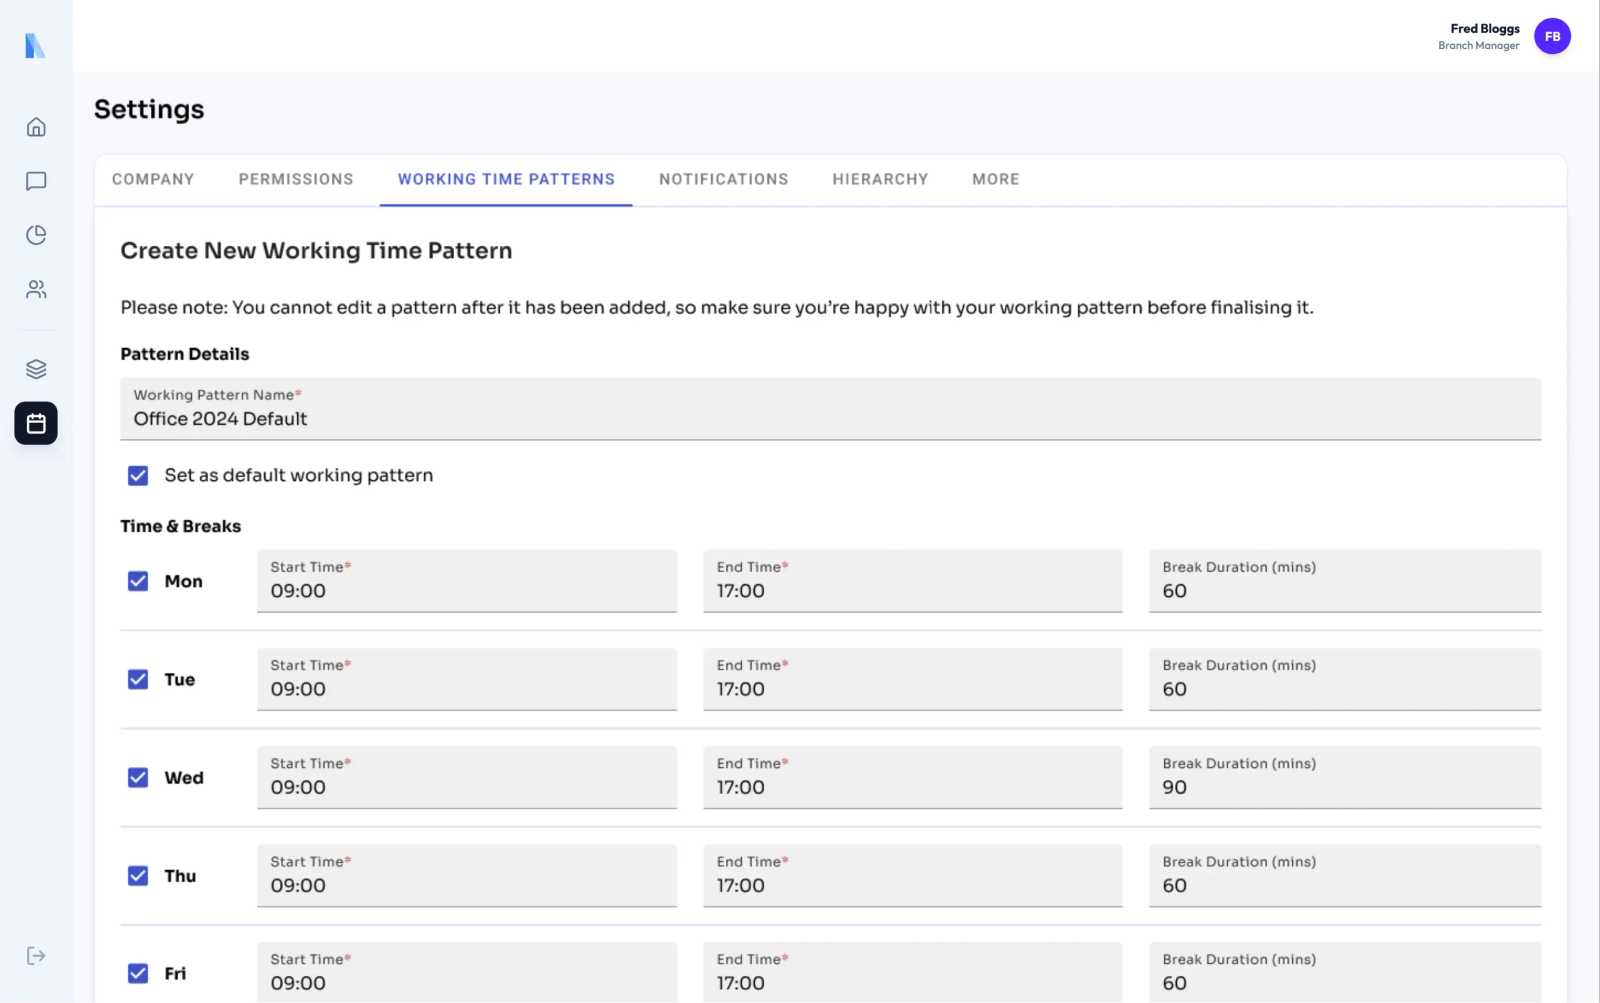
Core requirements assumed a blanket 9-to-5 schedule across all staff, which would have severely skewed productivity and engagement metrics for flexible, job-share, or part-time staff. I argued against shipping a blanket schedule even for v1 since that would penalise part-time workers and require an eventual architectural rewrite. Instead, I designed a comprehensive hierarchy-based working time pattern system that can be assigned across franchise locations, departments, and user groups (e.g. Winkworth Sales & Lettings → West London → Ealing → Acton → Acton Sales). Telemetry is fed into a shift-aware normalisation engine that calculates fair attribution ratios and eliminates part-time performance skew.
AI-Assisted Rapid Prototyping via MCP Server
We leveraged Model Context Protocol (MCP) to connect Storybook components, JIRA/Confluence requirements, and Figma tokens directly to Claude and Cursor AI agents, with project standards codified in Rules and Skills. The single source of truth was maintained in code: Angular Material theme variables were attached to custom semantic tokens (mat.define-theme, --mat-sys-primary: var(--custom-color-primary, #231f54), etc.) and distributed via MCP. Rather than static Figma frames, developers and stakeholders interacted with AI-assisted front-end mockups featuring live Chart.js components and realistic data streams. This enabled dynamic edge cases (such as inactive button states, missing data, or warnings when datasets exceed 60K lines) to be evaluated in series with larger user flows.
Design Refinement, Microcopy & Handoff
Delivery of product flows was coupled with informed communication methods for maximum cross-functional collaboration. I recorded targeted short video walkthroughs alongside interactive prototype links prior to refinement discussions, enabling developers and stakeholders to digest complex data flows, edge cases, and state boundaries. To protect daily operations, we audited user actions throughout the platform: high-impact destructive actions were rewritten with unambiguous, descriptive contextual copy (e.g. replacing vague 'Are You Sure?' prompts with detailed impact modals: 'Delete This Node: Deleting this node will also delete 2 child nodes and will affect 2 users... Please select Confirm below to delete Acton Sales').
AI-Assisted Accessibility & QA Testing
Standard manual design audits frequently missed glaring accessibility issues that weren't quickly identified with the human eye. We integrated Axe-core into Playwright CI/CD test suites, running automated scans across rendered Angular Material components on every pull request. This caught critical regressions early, including missing discernible button text, color contrast ratio thresholds, and empty table headers, ensuring design drift remained minimal before human interaction. Automating accessibility testing gave developers instant guidance based on design system documentation directly in their pull requests, maintaining compliance with WCAG 2.1 AA without slowing down sprint velocity.
Post-Launch Continuous Discovery
Understanding real user insights post-launch was critical to iterating beyond v1. We deployed Contentsquare and Hotjar tracking across primary analytics views to measure actual click density, scroll reach, widget interaction hierarchy, and identify where users experienced friction or rage-clicked. Interaction telemetry was cross-referenced with follow-up branch manager interviews to distinguish between perceived and true UX bottlenecks. Post-launch time-to-insight was evaluated against our discovery baseline, confirming managers could diagnose daily bottlenecks in a single morning check without spreadsheets. Real user friction metrics were converted directly into prioritized Jira tickets for upcoming patches and v2 features.
Psychology Insights & Behavioral Heuristics
Core interaction models were grounded in proven psychological principles to reduce cognitive load and keep complex workflows intuitive for first-time users.
Information Hierarchy
Visual weight should reflect informational priority
Service Architecture & Interactive Logic Maps
System journeys mapping decision points, entitlement logic, and state transitions across the platform.
01. Company User Workspace (Management Dashboard & Operational Drilldowns)
Mapping the daily flow that business owners and branch managers log into to inspect modular sections of their business: from executive health cards to granular Communications, Sales, Lettings, and Productivity drilldowns.
Things to Consider
Missing Historical Baseline
During initial onboarding or when reviewing newly recruited agents, comparing current performance against prior periods yields empty or misleading deltas. The UI suppresses comparative delta badges (e.g. ±% vs Last Month) and displays a "Building Baseline" indicator alongside branch-wide averages until reliable historical depth exists.
Silent Agent Poller Dropout
If a local OS daemon or cloud integration halts telemetry polling (e.g. expired OAuth token, terminated daemon, or network disconnection), an active agent can incorrectly appear to have zero output. The dashboard surfaces an inline "Telemetry Poller Degraded" alert with last-synced timestamps to prevent false negative evaluation.
Insufficient Data for Actionable Insights
Generating algorithmic recommendations on sparse activity sets (such as post-holiday returns or short assessment windows) introduces noisy, low-confidence conclusions. High-level automated insights are withheld until activity surpasses a statistically valid sample threshold (e.g. 14+ active shifts).
02. B2B Multi-Tenant Platform Admin (Customer Provisioning & Agent Catalogue)
Managing B2B customers in a single unified portal with bespoke 4-step CRUD/setup wizard functionality, live Entra ID provisioning handshake, cross-tenant audit controls, and secure customer impersonation.
Things to Consider
Entra ID Sync Timeout & Provisioning Hang
Customer tenants with thousands of unindexed directory objects or restricted Azure consent permissions can cause initial sync handshakes to stall. The wizard avoids indefinite loading by replacing spinners with real-time API diagnostic logs and providing an asynchronous background provisioning fallback.
Expired Cloud Agent Keys & Silent Token Revocation
Customer IT administrators frequently rotate Azure client secrets or VoIP API credentials without notifying the productivity platform. B2B admins require centralized heartbeat alerts that immediately flag non-responsive integrations before data collection pipelines fail.
Unbounded Impersonation & Audit Attribution Risk
When support engineers impersonate customer administrators to troubleshoot configurations, modifications risk appearing as if executed by the client. The system enforces an omnipresent session warning banner, automated timeout restrictions, and explicit super-admin audit log attribution.
03. Customer Admin Workspace (Organisation Settings, Hierarchy & Employee Sync)
Enabling Admin teams to effectively CRUD their organisation data: multi-tiered branch and department hierarchies, automated employee directory sync from Azure/Entra ID, customized agent distribution, and hierarchy-based working time patterns.
Things to Consider
Mismatched Entra Directory Mapping (Directory Purgatory)
Staff synced from Azure/Entra ID often lack structured departmental or branch attributes in corporate Active Directories. Rather than silently dropping or misplacing these users, the system stages them in an unassigned review inbox with batch-mapping tools to avoid corrupting team analytics.
Non-Standard & Rotational Shift Misattribution
Flexible, part-time, or job-share personnel operating outside rigid 9-to-5 schedules risk receiving artificial "idle" flags. The normalisation engine strictly conditions activity indexing on the active shift calendar, preventing part-time workers from being penalized in branch metrics.
Local Agent Daemon Inactivity & Permission Revocation
In hybrid desktop environments, users may shut down background OS tracking daemons or revoke accessibility permissions. The admin console flags sudden client-side telemetry drops with targeted employee re-engagement notifications rather than mischaracterizing software downtime as zero productivity.
High-Impact Node Deletion Safeguards (Descriptive Friction)
Deleting branch nodes or reorganising department trees risks unlinking active negotiators and corrupting reporting baselines. To protect daily operations, high-impact deletions require descriptive, unambiguous confirmation modals that explicitly declare child node and user count cascade impact (e.g. declaring that deleting Acton Sales deletes 2 child nodes and affects 2 users) rather than generic "Are you sure?" prompts.
User Archetypes & Friction Points
Key personas synthesized from stakeholder interviews, support escalations, and direct workflow observations.
The Branch Manager / Franchise Owner
"I need to identify retention gaps and operational bottlenecks in a single morning check without cross-referencing multiple platforms and spreadsheets."
Pain Points
- •Overwhelmed by dense, cluttered tables across five legacy desktop tools
- •Inconsistent visual hierarchy hid vital secondary metrics, causing branch bottlenecks to go unnoticed
- •Performance could not be compared across timeframes (today vs. yesterday or 30-day rolling averages) without manual spreadsheet math
Goals
- ✓Single morning check consolidating telephony, CRM, and lettings into glanceable radial metric cards
- ✓Modular date comparison tooling with rolling 30-day benchmarking directly on screen
- ✓Proactive bottleneck alerts that highlight customer retention gaps before clients churn
The Sales & Lettings Negotiator
"I want to focus on clients, not filling in activity reports. The system should record what I do automatically and judge me fairly."
Pain Points
- •Manual activity logging takes 20+ minutes per working day across disconnected systems
- •Rigid 9-to-5 assumptions penalised part-time, job-share, or flexible working rotas with artificial underperformance flags
- •Phone call outcomes and client viewing logs had to be entered manually into the CRM
Goals
- ✓Zero-input automatic activity capture from background listener daemons and VoIP telephony
- ✓Shift-aware normalisation calculating fair attribution metrics regardless of rota type
- ✓Clear "actions by contact type" and individual vs team benchmarks to drive self-improvement
The Platform & Customer Administrator
"I need to manage complex branch hierarchies, configure shift patterns, and troubleshoot onboarding blockers without calling developers."
Pain Points
- •Azure/Entra ID employee syncs frequently produced unmapped directory records that corrupted reporting trees
- •Lack of user impersonation meant diagnosing onboarding issues required lengthy back-and-forth support calls
- •Vague destructive confirmation dialogs caused accidental deletion of branches and unlinking of active negotiators
Goals
- ✓Multi-tiered hierarchy builder (offices, departments, roles) with comprehensive working time patterns
- ✓Native user impersonation ("View As" mode with session banner) for instant diagnostic resolution
- ✓High-impact confirmation modals with explicit impact warnings (child nodes and affected user counts)
Outcomes & Reflection
Connecting our delivery pipeline and sprint runway to measurable business outcomes, the platform was deployed live across 5 franchise branches, providing clear operational visibility and cutting daily diagnostic time to a single morning check.
- ✓Design to End Product Parity: Feeding our Angular Material Storybook components into Claude and Cursor via MCP established 1:1 prototype fidelity. Maintaining a validated 1-2 sprint runway eliminated design drift, idle time, and mid-sprint rework for the dev team.
- ✓Significantly Reduced Cognitive Overload: Consolidating fragmented spreadsheets, CRM actions, and telephony into glanceable, radial metric cards cut daily diagnostic time to a single morning check. Deployed live across 5 franchise branches, providing clear operational visibility without manual spreadsheet math.
- ✓Whitelabel Capable Platform: A tokenized architecture enabled self-serve brand theming without front-end dev tickets. Integrated native user impersonation empowered administrative and support teams to diagnose client onboarding blockers instantly without need for follow-up calls.
- ✓AI-Assisted Workflow Efficiency: Wiring Axe-core into Playwright CI/CD test suites caught critical WCAG 2.1 AA and token contrast regressions directly on pull requests. Replaced manual pre-release audits with automated guardrails, keeping sprint velocity high and compliance continuous.
- ✓Sub-400ms Response Times: Met Doherty threshold performance benchmarks across complex, high-density real-time metrics with asynchronous query loading and intelligent caching.
- ✓Zero Part-Time Performance Skew: Shift-aware working time patterns calculated fair attribution ratios, ensuring flexible and rotational workers were not penalised in branch productivity rankings.
- ✓Closed-Loop Continuous Discovery: Contentsquare and Hotjar heatmaps coupled with manager interviews directly fueled prioritized Jira sprint backlogs for post-launch patches and v2 features.